
The Gaussian or ‘Normal’ probability density function is the familiar bell-shaped curve. In statistics, a closely related distribution is the t-distribution. The t-distribution is used when you want to know if the means (averages) of two sets of data are the same or not. For example, suppose you have a large population of males and females (for example, all the seniors in some very large high school). If you have 5 sample test scores from a group of males and 5 sample test scores from a group of females, the t-test can be used to determine if the true average score for all males and all females in the group under investigation (all seniors) are the same or not.
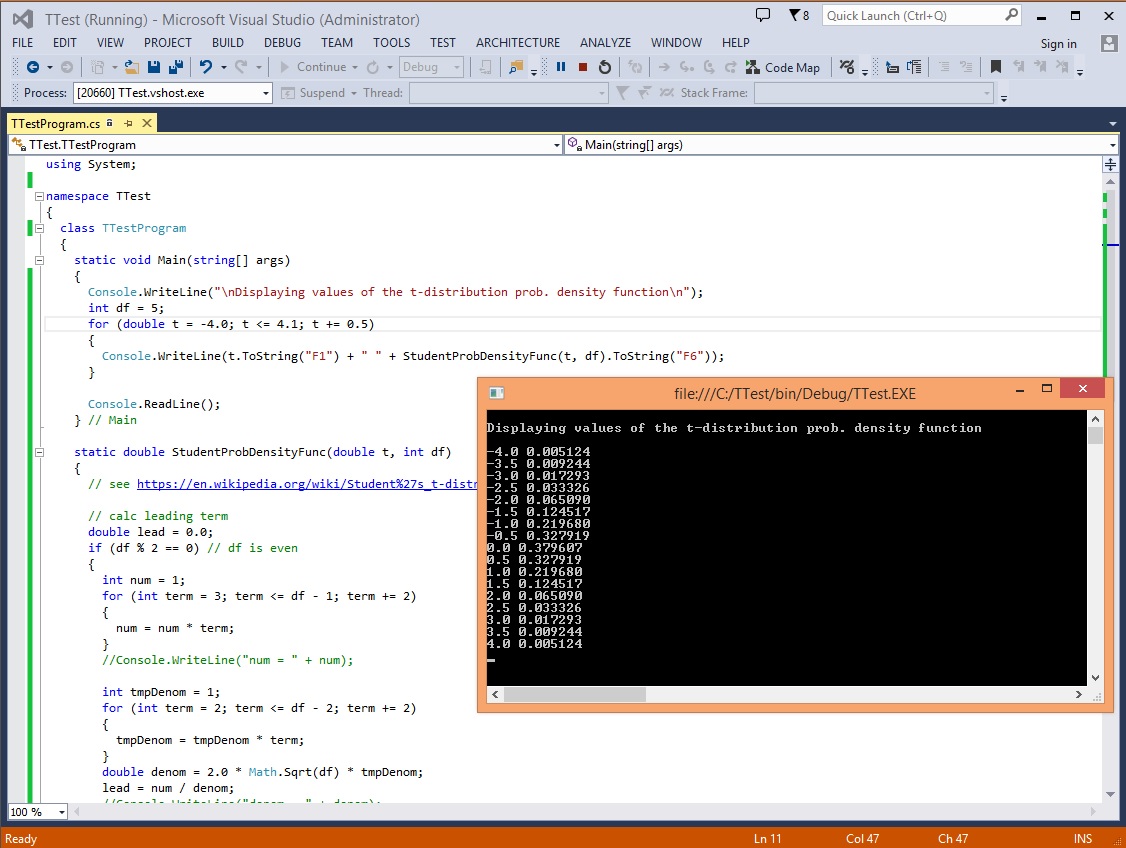
Just for fun I thought I’d generate a graph of the t-distribution. The Wikipedia article on the t-distribution gave me the equation for the density function. The equation is kind of wacky and involves the Gamma function (which looks like a capital ‘T’ with the left part of the top crossbar missing). Luckily, the complicated part of the t-distribution equation that involves Gamma can be computed relatively easily.

The equation for the t-distribution function also involves “degrees of freedom” which has a symbol resembling a lower case ‘v’. Degrees of freedom (also abbreviated df) is a tricky concept, but for the t-test, the degrees of freedom is 1 less than the sample size (so df = 4 for the example above). There is a separate t-distribution for each possible value of the df.
I wrote a C# program that printed out values of t and the associated values of the t-distribution function, copied those values into Excel, and used the values to display a graph. I could have computed the values directly in Excel but the equation would be very messy. The resulting graph is the probability density function (PDF).
As it turns out, the PDF graph of the t-distribution isn’t particularly useful. When performing a t-test, you need to know the area under the graph. This is an entirely different problem from computing the value of the density function. It is possible to make a graph of the area under the density function. This graph has an S-shape and is called the cumulative distribution function (CDF). The difference between the PDF and CDF can be quite confusing.
 .NET Test Automation Recipes
 Software Testing
 SciPy Programming Succinctly
 Keras Succinctly
 R Programming
 2026 Visual Studio Live
 2025 Summer MLADS Conference
 2026 DevIntersection Conference
 2025 Machine Learning Week
 2025 Ai4 Conference
 2026 G2E Conference
 2026 iSC West Conference
You must be logged in to post a comment.